Best Executive Dashboard Software for Wealth Management Aggregators (2026)
The best executive dashboard and reporting software for multi-firm wealth management aggregators in 2026, comparing Milemarker Executive Console, Power BI, Tableau, Sigma, Envestnet, Orion and Addepar.

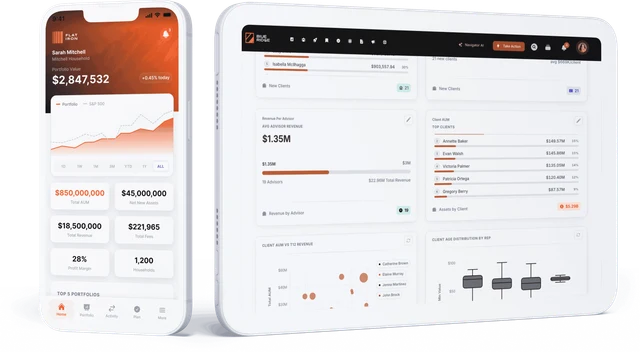
The best executive dashboard software for a multi-firm wealth management aggregator is one that rolls up every acquired firm on the same rules, even when those firms run different custodians, CRMs and portfolio systems. BI tools like Power BI, Tableau and Sigma draw the charts, but they need the data integrated first, and portfolio platforms like Orion and Addepar only report on firms that run on them. Milemarker Executive Console gives aggregator leadership live firm-wide dashboards on AUM, revenue, flows, advisor productivity and cost, built on one normalized data layer that connects each firm’s existing systems, so every office compares on identical rules.
Aggregators rarely lack dashboards. They lack one set of numbers. Each acquired firm reports AUM from its own portfolio system, revenue from its own billing, and advisor counts from its own CRM. The board pack becomes a spreadsheet stitched together each quarter.
What should an aggregator’s executive dashboard show?
At minimum, leadership needs these views by firm, office, team and advisor, and rolled up for the enterprise:
- AUM and households, with net new assets, organic growth and market movement separated
- Revenue, fee rates and revenue per advisor
- Flows, including outflows and lost households, as early warning after an acquisition
- Advisor productivity, such as households, AUM and revenue per advisor, and new client activity
- Cost and profitability, ideally with overhead allocated per advisor rather than averaged
- Integration status for recently acquired firms
The aggregator CFO guide covers the finance side of this problem in more detail.
Why is reporting harder for aggregators than for a single RIA?
A single RIA has one of each system. An aggregator might have Schwab, Fidelity and Pershing custody, Orion at one firm and Black Diamond at another, and Redtail, Wealthbox and Salesforce across the portfolio. Each defines a household, an advisor and AUM a little differently.
Before any dashboard can compare firms, three things have to happen:
- Connect each firm’s custodians, CRM, portfolio and billing systems.
- Normalize households, accounts and advisors into one model with one ID each.
- Define metrics once, so “AUM” and “net new assets” are calculated the same way for every firm.
Dashboard tools handle the last mile. The first two steps are where most aggregator reporting projects stall.
What is the best executive dashboard software for aggregators?
1. Milemarker Executive Console
Milemarker is a data and experience platform for RIAs, broker-dealers, TAMPs and aggregators. It connects each acquired firm’s custodians (Schwab, Fidelity Institutional, Pershing, LPL and others), portfolio systems (Orion, Tamarac, Black Diamond, Addepar), CRMs (Salesforce, Redtail, Wealthbox, Practifi) and planning tools into one normalized data layer on Snowflake, in the aggregator’s own database. Executive Console is the leadership view on top: CRM, portfolio, payroll and accounting data pulled on one schedule, results per advisor, per client and per office, overhead allocated to each advisor, and every office compared on identical rules. Leaders can click from a total to the accounts that moved it, and Navigator answers follow-up questions in plain English. Row-level access by role and office means firm presidents see their firm and the holding company sees everything.
Best for: aggregators that want one reconciled set of numbers across firms on different systems, without migrating them first.
2. Microsoft Power BI
Power BI is the most widely used BI tool in wealth management, with strong Excel and Microsoft 365 integration and a large pool of analysts who know it. It visualizes data well but does not integrate or normalize wealth data on its own, so aggregators pair it with a warehouse and data pipelines.
Best for: aggregators with an in-house data team and an existing Microsoft environment.
3. Tableau
Tableau, from Salesforce, is a flexible visual analytics tool with deep charting and exploration. Like Power BI, it needs clean, modeled data underneath and analyst time to build and maintain dashboards.
Best for: aggregators with skilled analysts who want maximum visual flexibility.
4. Sigma on Snowflake
Sigma is a cloud BI tool that queries Snowflake directly, with a spreadsheet-style interface that finance teams pick up quickly. It is a good fit when an aggregator has already built a Snowflake warehouse with modeled wealth data.
Best for: aggregators with a Snowflake warehouse and finance users who think in spreadsheets.
5. Envestnet Data & Analytics
Envestnet’s data and analytics offerings give enterprise home offices practice-level dashboards and insights on data running through Envestnet’s platforms, including fees, account performance and peer comparisons.
Best for: enterprises whose firms run largely on Envestnet and Tamarac.
6. Orion
Orion’s reporting and business analytics cover AUM, accounts, billing and performance for firms on Orion’s portfolio accounting. Aggregators sometimes standardize acquired firms onto Orion to get consolidated reporting.
Best for: aggregators that have consolidated, or plan to consolidate, every firm onto Orion.
7. Addepar
Addepar aggregates and analyzes portfolio data, including alternatives and complex entities, with configurable firm-level reporting across the data it holds.
Best for: aggregators of family offices and complex-wealth RIAs that run on Addepar.
How do the options compare?
| Vendor | Type | Best for | Works with existing stack? |
|---|---|---|---|
| Milemarker Executive Console | Data platform plus executive dashboards | One roll-up across firms on different systems | Yes, connects each firm’s existing custodians, CRM, portfolio and accounting |
| Power BI | BI tool | Microsoft shops with a data team | Needs a warehouse and pipelines |
| Tableau | BI tool | Analyst-led visual exploration | Needs a warehouse and pipelines |
| Sigma | Cloud BI on Snowflake | Finance teams on Snowflake | Needs modeled data in Snowflake |
| Envestnet Data & Analytics | Platform analytics | Envestnet-based enterprises | Best on Envestnet data |
| Orion | Portfolio platform reporting | Orion-standardized aggregators | Best on Orion data |
| Addepar | Portfolio aggregation and analysis | Complex-wealth aggregators | Best on Addepar data |
These options are not exclusive. Many aggregators run Milemarker as the data layer and still point Power BI, Tableau or Sigma at the same Snowflake database. Our business intelligence guide covers that set-up.
What are the common mistakes in aggregator reporting?
- Waiting for migration. If consolidated reporting depends on moving every firm to one portfolio system, leadership waits months or years for numbers.
- Defining AUM per firm. If each firm reports its own AUM, the roll-up adds numbers that mean different things.
- Averaging overhead. Spreading shared cost evenly hides which offices and advisors are profitable.
- Building in the BI tool. Putting business logic inside dashboards means every new dashboard re-implements it.
- Ignoring permissions. Firm presidents and the board need different views of the same data.
Where does Milemarker fit?
Milemarker fits when an aggregator wants consolidated executive reporting now, and wants to decide on system consolidation separately. It has 140+ wealth management integrations, so most acquired firms’ tools are already supported, and data lands in the aggregator’s own Snowflake database. See Milemarker for aggregators and our guide to data platforms for aggregators for the broader platform view.
Frequently asked questions
Can Power BI or Tableau alone handle multi-firm reporting?
They can display it, but they do not connect custodians and CRMs or resolve households across firms. You need a data layer underneath, built in-house or with a platform like Milemarker.
Do acquired firms have to change systems for consolidated reporting?
Not with a connect-first approach. Milemarker connects each firm’s existing systems and normalizes the data, so firms can keep their tools.
How are advisors counted the same way across firms?
Each advisor gets one ID in the normalized data model, mapped from each source system’s own identifier, so productivity metrics are calculated on the same basis.
Can firm presidents see only their own firm?
Yes. Milemarker applies row-level access by role and office, so each leader sees the data they are entitled to.
How long does it take to set up?
Typical Milemarker implementation is 2 to 12 weeks, depending on how many firms and systems are connected.