
See Your Firm's Health in 60 Seconds.
See Your Firm's Health in 60 Seconds.
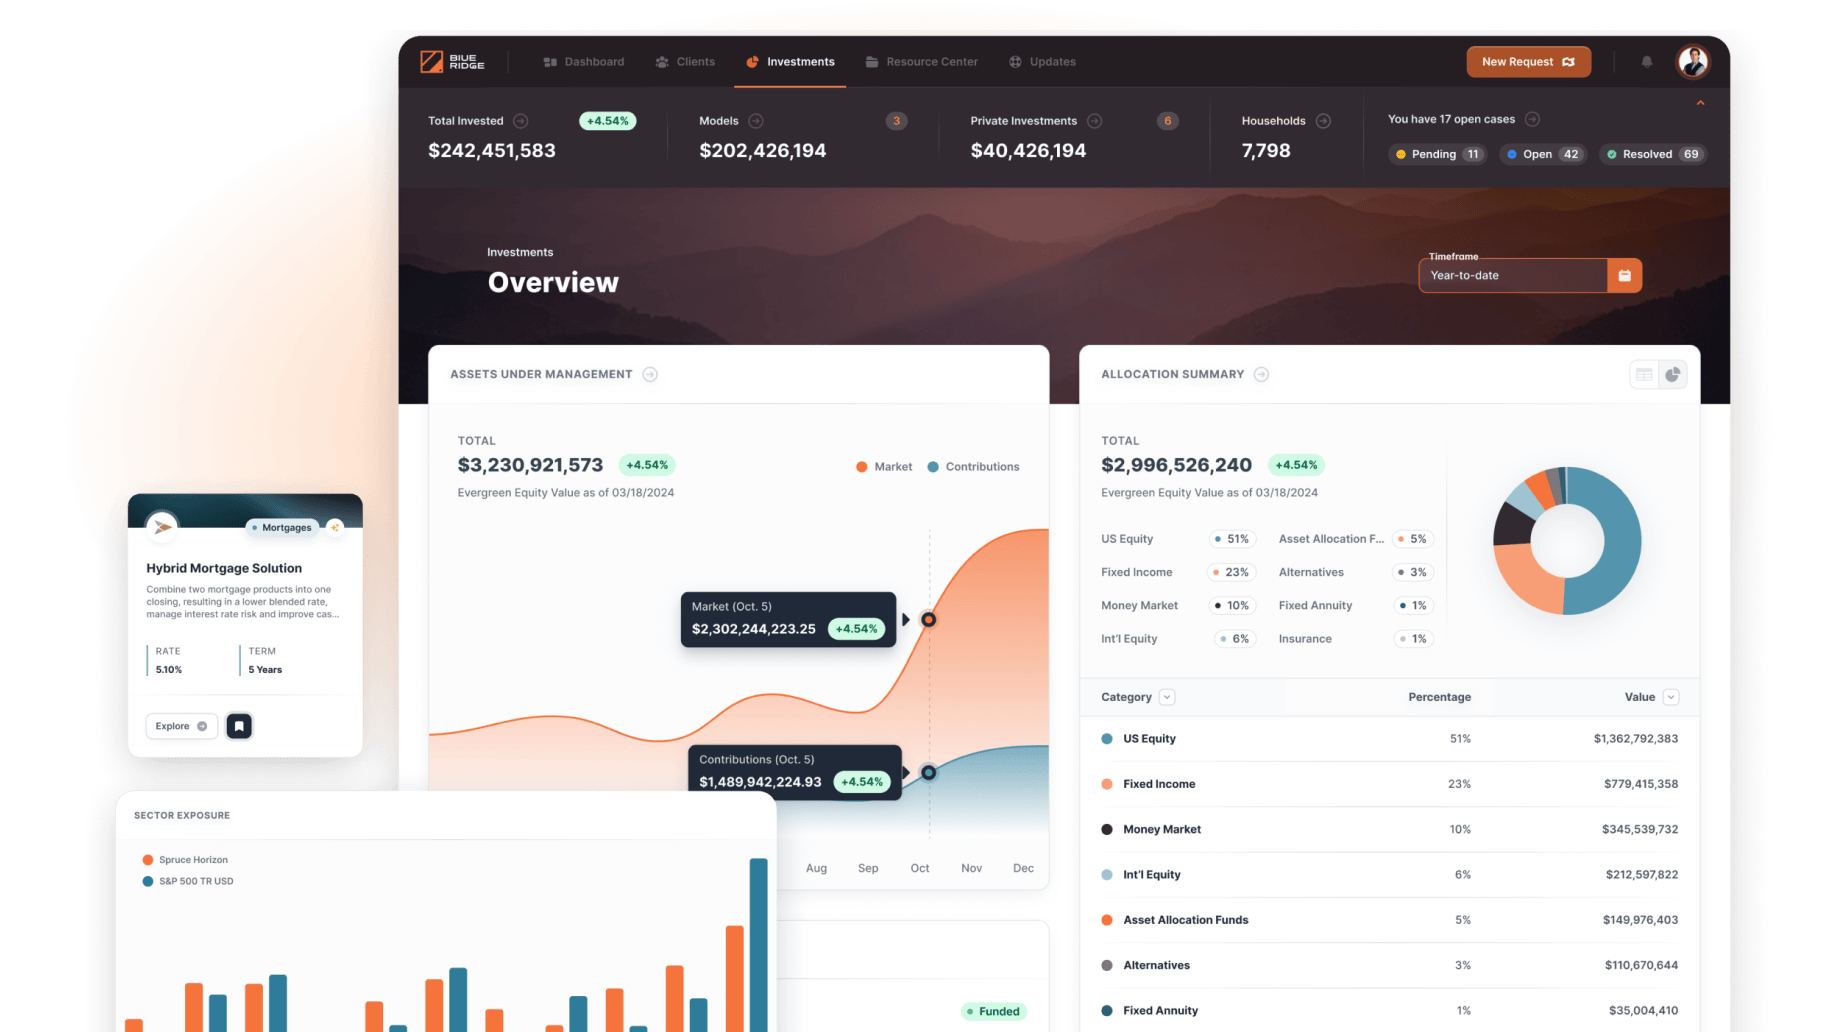
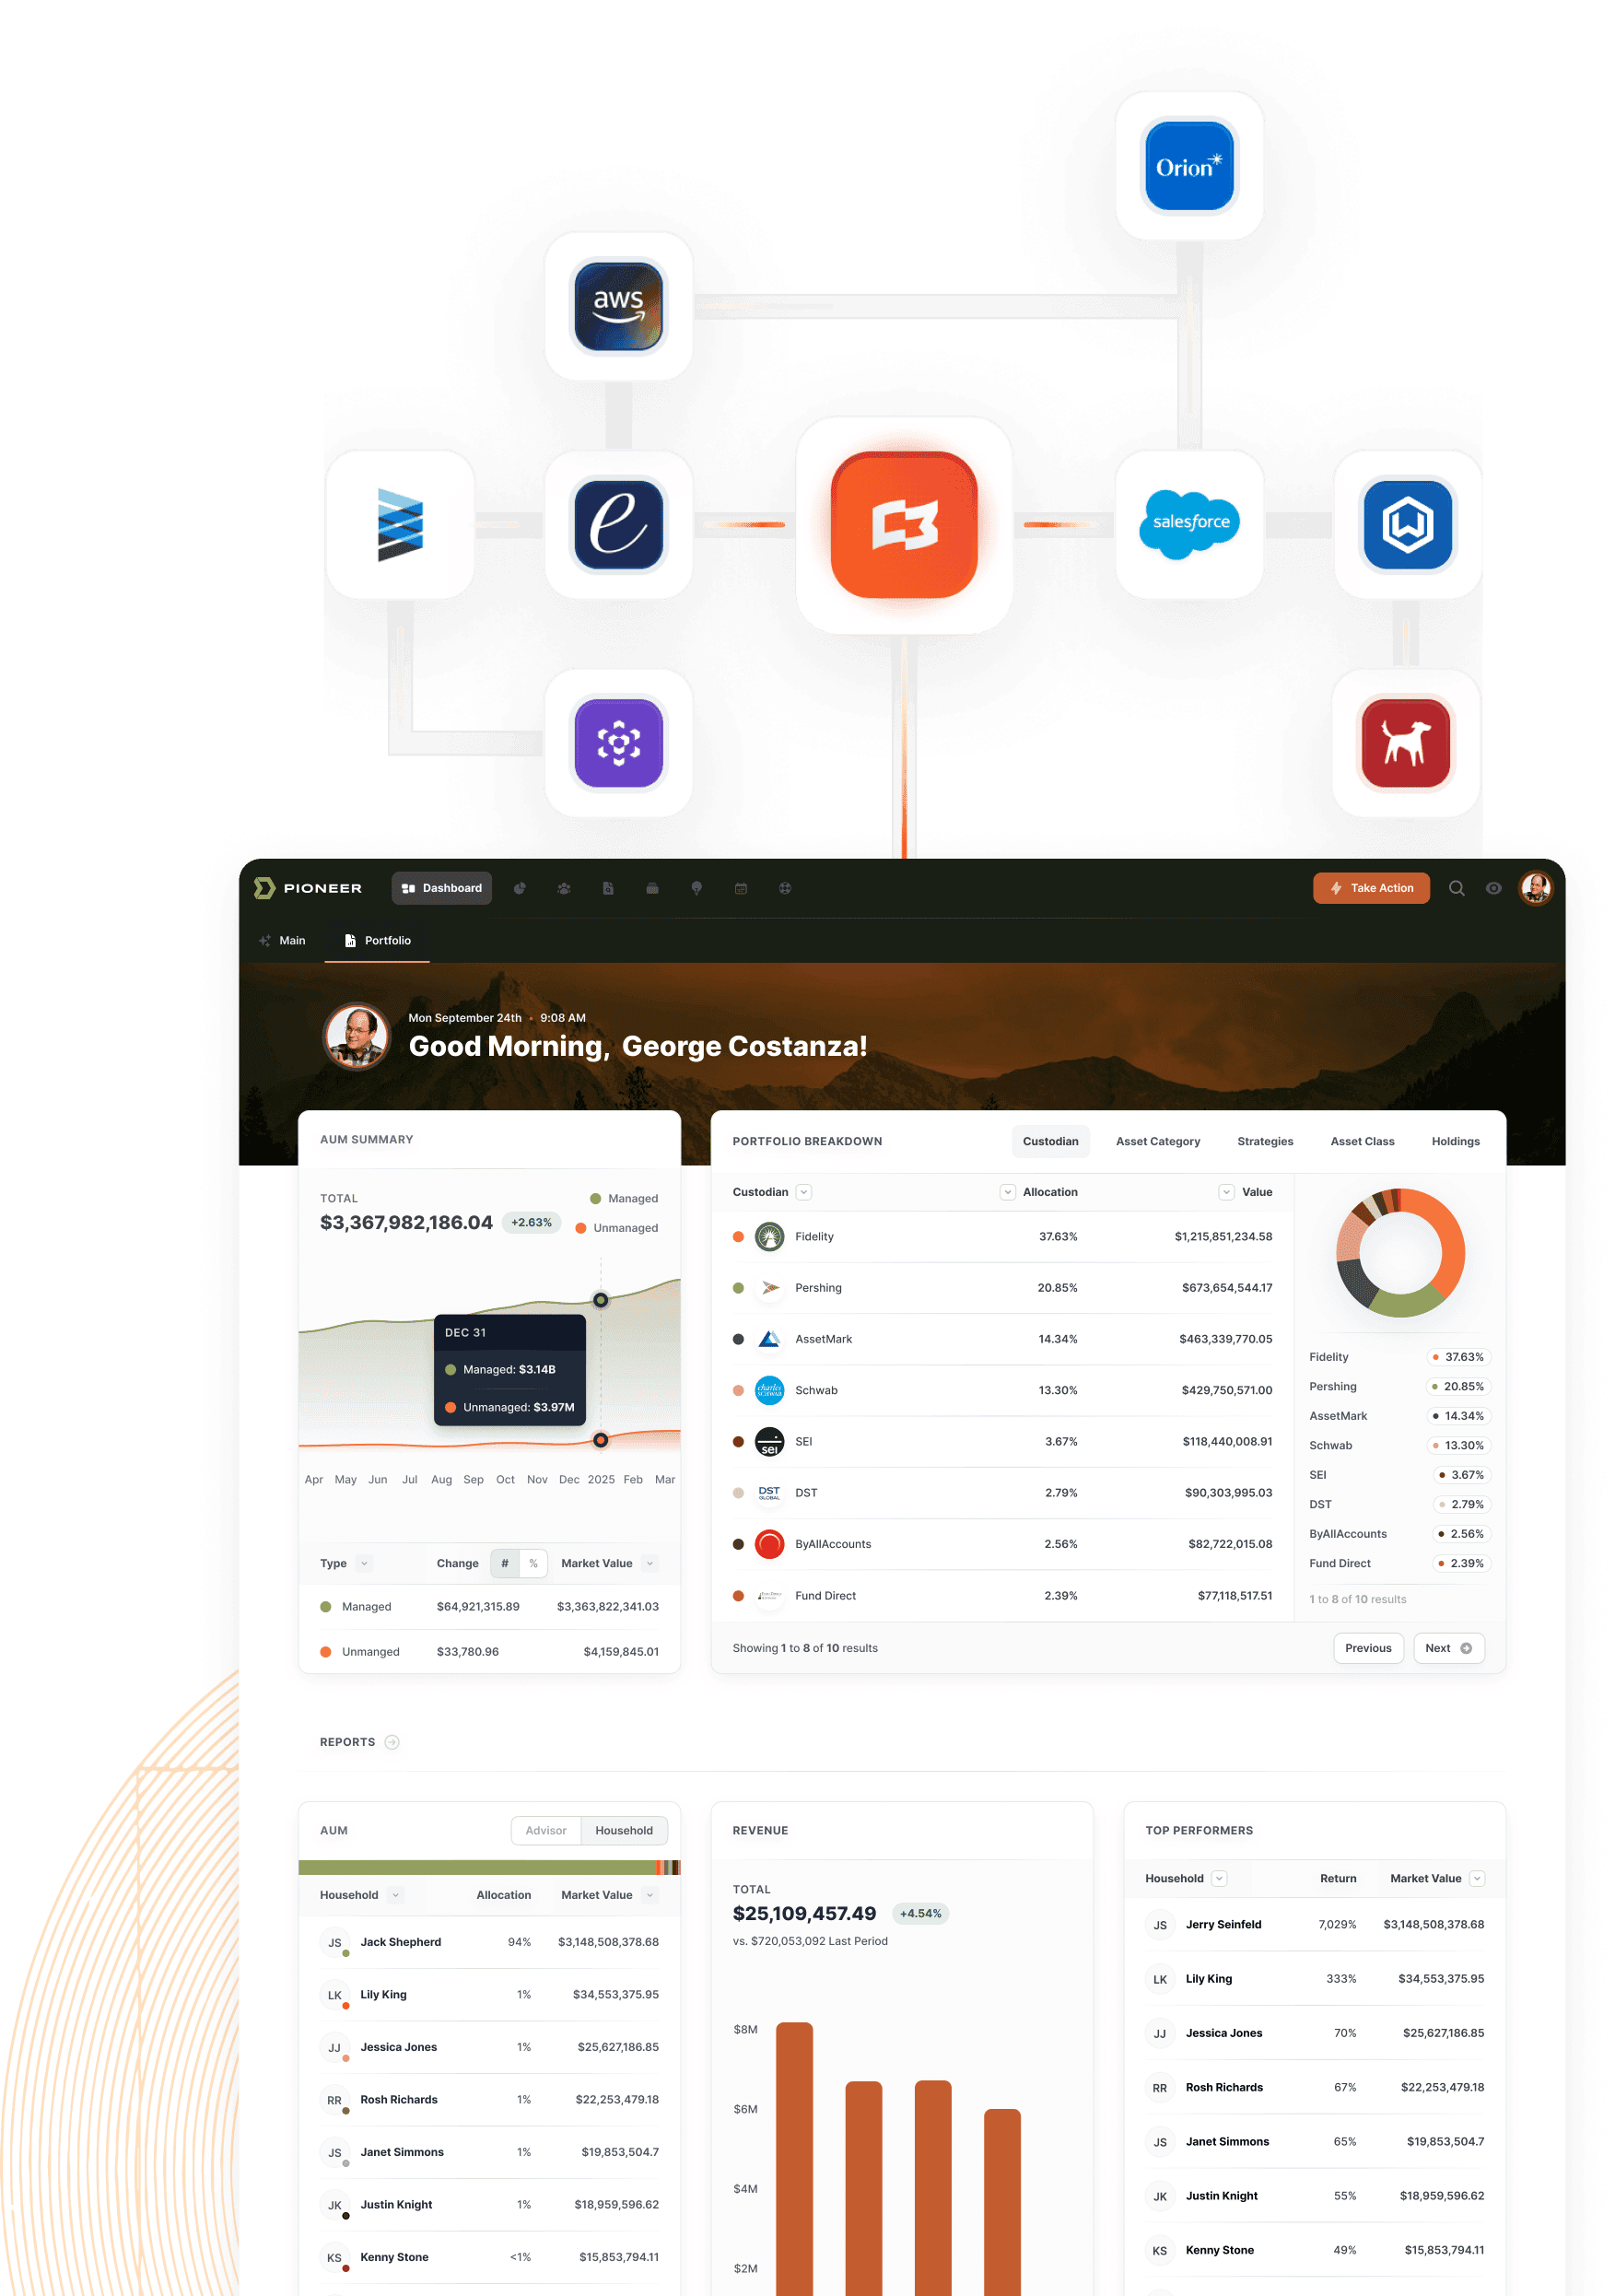
Make decisions with confidence. The CEO dashboard you've needed.
Make decisions with confidence. The CEO dashboard you've needed.


Million-Dollar Decisions. Spreadsheet Data.
Board meeting. Tuesday. 2pm.
"What's driving our margins this quarter?"
Scramble. Export. Calculate. Hope.
"How profitable is the Chicago office?"
Text your COO. Wait. Get an answer that’s three weeks old.
"Which advisors are actually growing revenue?"
Another spreadsheet. More guesswork.
You're running a sophisticated business with Stone Age data.
Real Numbers. Real Time
Real Numbers. Real Time
Real Simple.
Real Simple.

Know Your True Costs
Know Your True Costs
Cost per advisor. Office profitability. Technology spend. All updating automatically.
Cost per advisor. Office profitability. Technology spend. All updating automatically.

See What's Working
See What's Working
Which services make money. Which advisors drive growth. Which clients are profitable.
Which services make money. Which advisors drive growth. Which clients are profitable.

Pay With Confidence
Pay With Confidence
Advisor compensation calculated automatically. No more payout disputes or manual reconciliation.
Advisor compensation calculated automatically. No more payout disputes or manual reconciliation.
Make Better Decisions
Make Better Decisions
Revenue trends. Margin analysis. Growth opportunities. Updated every morning.
Revenue trends. Margin analysis. Growth opportunities. Updated every morning.

The Difference
The Difference
"Give Me Our Numbers" = 3-Day Excel Project
Board Prep = Stress & Spreadsheets
Advisor Complaints About Pay = Weekly Occurrence
Strategic Decisions = Gut Feeling + Hope
"Give Me Our Numbers" = 3-Day Excel Project
Board Prep = Stress & Spreadsheets
Advisor Complaints About Pay = Weekly Occurrence
Strategic Decisions = Gut Feeling + Hope
"Give Me Our Numbers" = 3-Day Excel Project
Board Prep = Stress & Spreadsheets
Advisor Complaints About Pay = Weekly Occurrence
Strategic Decisions = Gut Feeling + Hope

"Give Me Our Numbers" Inquiries

Open Dashboard
Board Prep
10 Minutes
Advisor Pay Transparency
Automatic
Strategic Decisions
Data-Driven Confidence
Real Results
And if you want to run a profitable business, the focus has to be on collaborating with the advisors on identifying and measuring clear goals. Milemarker™ makes all of this possible.

Shannon Spotswood
CEO of RFG Advisory

Automated
compensation transparency
Real-time
advisor profitability
75%
less time on manual reporting
Data-driven
M&A decisions

What CEOs
Actually Need

Financial Truth

True cost per advisor
Real office profitability
Actual margins (not estimates)
EBITDA that adds up

Growth Intelligence
Which solutions make money
Which advisors are growing
Which clients are profitable
Where opportunities hide

Operational Clarity
Compensation that's transparent
Workflows that work
Compliance that's automatic
Problems before they happen

Built For
How You Work
Mobile Dashboards
Your numbers. Your phone. Your flight to the conference.

Exception Alerts
Only get pinged when something needs your attention.

Board-Ready Reports
Professional slides that update themselves.
Enterprise Security
SOC 2 compliant. Because your auditors care.

Implementation Reality
Implementation Reality
No IT drama. No system downtime. No data migration disasters.
No IT drama. No system downtime. No data migration disasters.
Connect your systems
Week 1

Connect your systems
Week 1
Build your dashboard
Week 2

Build your dashboard
Week 2
Train your team
Week 3

Train your team
Week 3
Make better decisions
Week 4
Make better decisions
Week 4
Why This Matters
You didn't build a business to manage spreadsheets.
Let Milemarker™ handle the numbers.


Empowering Advisors To Enjoy Every Mile.
Phone
+1 (470) 502-5600
Mailing Address
Milemarker
PO Box 262
Isle Of Palms, SC 29451-9998
Legal Address
Milemarker Inc.
16192 Coastal Highway
Lewes, Delaware 19958
Built by Teams In:
Atlanta, Charleston, Cincinnati, Denver, Omaha & Portland.


Partners


Platform
Solutions
© 2026 Milemarker Inc. All rights reserved
DISCLAIMER: All product names, logos, and brands are property of their respective owners in the U.S. and other countries, and are used for identification purposes only. Use of these names, logos, and brands does not imply affiliation or endorsement.
Empowering Advisors To Enjoy Every Mile.
Phone
+1 (470) 502-5600
Mailing Address
Milemarker
PO Box 262
Isle Of Palms, SC 29451-9998
Legal Address
Milemarker Inc.
16192 Coastal Highway
Lewes, Delaware 19958
Built by Teams In:
Atlanta, Charleston, Cincinnati, Denver, Omaha & Portland.
Partners
Platform
Solutions
© 2026 Milemarker Inc. All rights reserved
DISCLAIMER: All product names, logos, and brands are property of their respective owners in the U.S. and other countries, and are used for identification purposes only. Use of these names, logos, and brands does not imply affiliation or endorsement.
Empowering Advisors
To Enjoy Every Mile.
Phone
+1 (470) 502-5600
Mailing Address
Milemarker
PO Box 262
Isle Of Palms, SC 29451-9998
Legal Address
Milemarker Inc.
16192 Coastal Highway
Lewes, Delaware 19958
Built by Teams In:
Atlanta, Charleston, Cincinnati, Denver, Omaha & Portland.
Partners