Mid Summer
From onboarding to investment analysis and platform-wide enhancements, this release is packed with upgrades designed to streamline workflows, enhance data visualization, and improve overall system flexibility. Here's what's new:
✨Smarter Onboarding
Adding new offices, users, connections, and data views is now easier than ever with a seamless setup flow. Pre-populated forms and dynamic permissions simplify onboarding, while newly introduced seeders improve workflow consistency and user interface configuration.
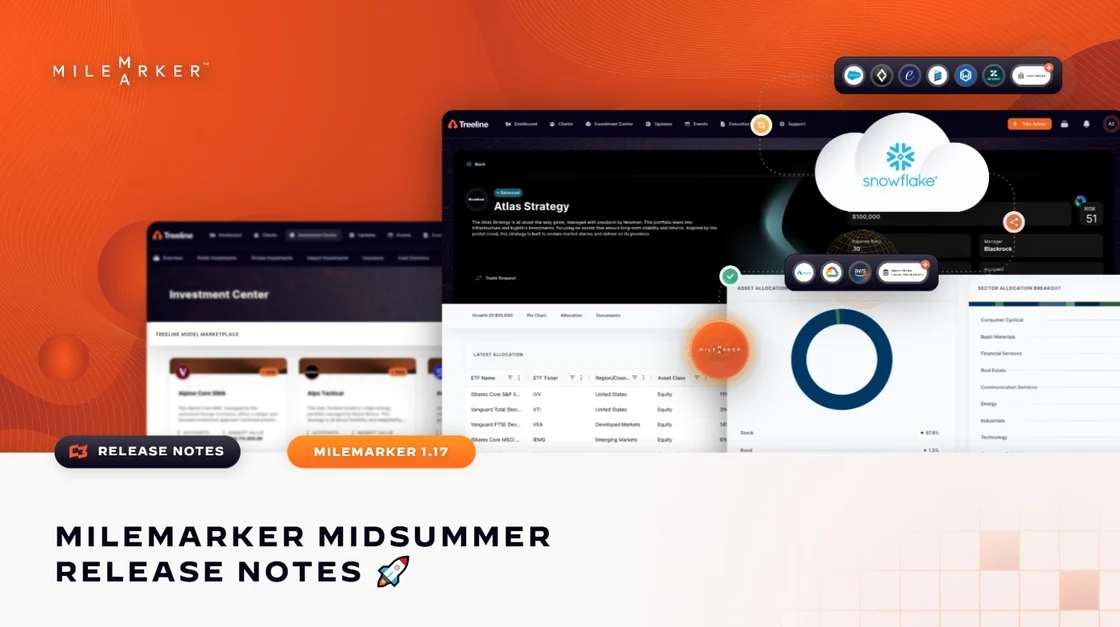
✨Enhanced Investment Center
We’ve added new asset allocation and sector breakout visualizations for clearer insights. The styling and hover states for bar and pie charts have been refined, and model cards now support view toggling and dynamic logo display—making it easier to understand and present investment models.
✨ Platform-Wide Upgrades
1. Workflow + Page Builder – Workflows now support conditionally visible “Take Action” drawers in datatables. We’ve enhanced dynamic field logic in Workflow Projections, added new options for customizing autofill behavior and formatting, and improved recursive schema handling for deep and complex structures.
2. UI + Admin Tools – Metric-enabled Page Builder elements now feature custom tooltips for better clarity. We resolved submenu visibility issues, added support for additional tenant-specific side menus, and made the Starter License option visible and selectable within the settings panel.
3. Data & Integration - This release includes expanded support for Salesforce projection subtypes and improved field handling. The Orion integration has been refactored to enhance token management and logging reliability. Additionally, support for light and dark theme logos per tenant has been added for consistent branding.
4. General Settings & System Config - We’ve introduced dynamic float formatting options and improved the clarity of configuration task filters and card layouts. Admin-only configuration tabs are now permission-controlled, and the file upload size limit has been increased to 75MB to support larger assets and data imports.
5. Charting + Visualizations - You can now create horizontal and stacked bar charts in the Investment Center. We’ve also optimized filtering, pagination, and sorting functionality for better usability, and chart height for sector and asset allocation visuals now adjusts dynamically for improved display.
Ready to see it in action?
Reply to this email or reach out to your Milemarker contact to schedule a walkthrough.